
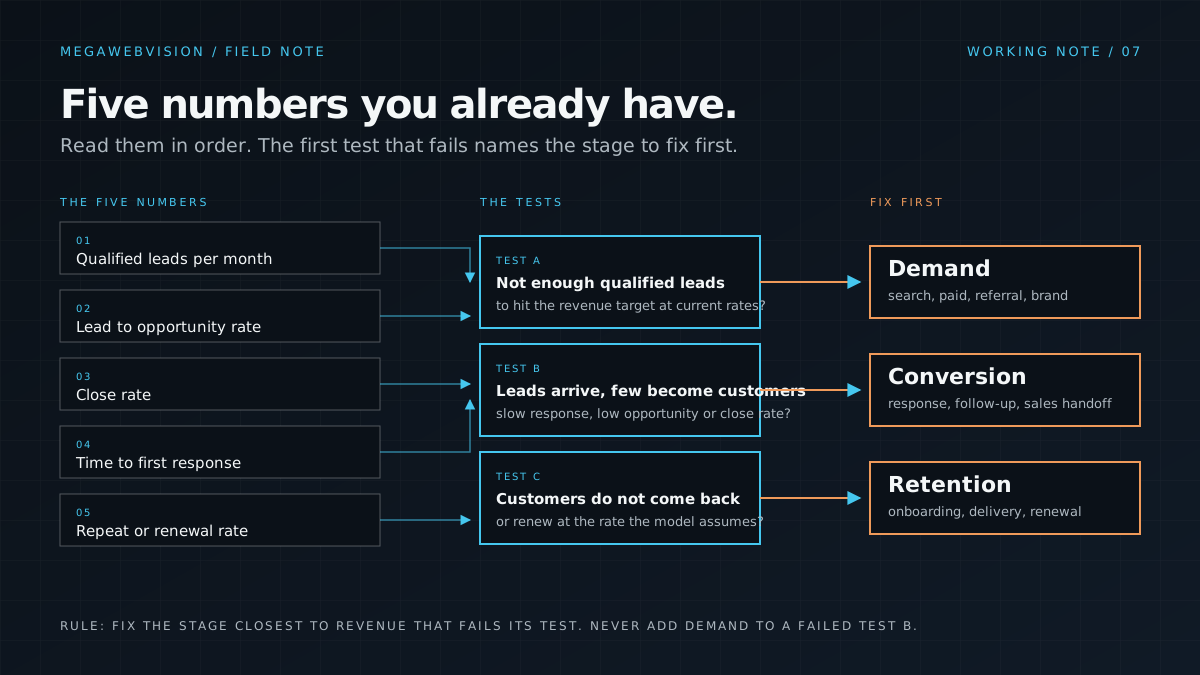
Five numbers most businesses already have tell you which stage limits revenue: qualified leads per month, lead to opportunity rate, close rate, time to first response, and repeat or renewal rate. Compare each to a plain benchmark for your kind of business. The stage that is furthest below its benchmark is the constraint. Fix that one first, prove it moved, then re-run the numbers. Fixing a stage that is not the constraint changes nothing.
One stage sets the ceiling
Revenue moves through stages. Someone has to want what you sell. They have to reach you and be qualified. Someone has to turn that inquiry into a sale. Then the customer has to come back, renew or refer. Each stage has a capacity. The lowest capacity sets the ceiling for the whole business, and spending on any other stage only builds inventory behind the bottleneck.
A plumbing company with plenty of calls and a booking rate that has slid to half of what it was does not need more calls. A specialty manufacturer that closes most of its quotes but only sees six real inquiries a quarter does not need a better proposal template. The mistake is common because every stage always looks improvable. The question is which one is holding the number down right now.
The five numbers you already have
You do not need a new dashboard. You need five figures, pulled from the CRM, the booking system and the accounting file for the same 90-day window.
- Qualified leads per month. Not raw inquiries. Leads that match what you sell, where you sell it, at a size worth serving. Count them by source.
- Lead to opportunity rate. The share of qualified leads that became a real conversation: a booked estimate, a scoped quote, a consultation held.
- Close rate. The share of opportunities that became paying customers within your normal cycle length.
- Time to first response. The median minutes between a lead record being created and the first logged human contact.
- Repeat or renewal rate. The share of customers from a prior period who bought again, renewed or expanded in the period that followed. For one-time services, use referral rate instead.
What each number is telling you
Qualified leads per month is the demand signal. If it is low relative to what your team could handle, and the other numbers are healthy, demand is the constraint. That is the only case where more marketing spend is the right first move.
Lead to opportunity rate and time to first response belong together. When response is slow, the opportunity rate drops, and the business reads it as poor lead quality. Look at response time first. If the median is over an hour, you do not yet know how good your leads are.
Close rate is the conversion signal once a real conversation has happened. A low close rate with fast response and a healthy opportunity rate points at pricing, the proposal, follow-up after the quote, or who is doing the selling.
Repeat or renewal rate is the retention signal, and it is the one most businesses do not look at because it takes longer to move. For a home services company on maintenance plans, a healthcare practice, a managed services provider or an ecommerce brand, it is often where the most margin is leaking.
The decision rule
Put the five numbers next to a plain benchmark for your kind of business. Your own best quarter is a fine benchmark if you have nothing else. Then apply the rule in order.
- If time to first response is over an hour, fix response first. It is the cheapest fix, it takes weeks rather than months, and it distorts every other number until it is handled.
- If response is under an hour and lead to opportunity rate or close rate is well below benchmark, conversion is the constraint. Fix follow-up, pricing presentation and the sales process before buying more leads.
- If conversion is at benchmark and repeat or renewal rate is well below it, retention is the constraint. Every new customer is replacing one you lost. Fix onboarding, service recovery and re-engagement.
- Only if response, conversion and retention are all at benchmark is demand the constraint. Now increase qualified leads, and expect the other numbers to hold.
- Fix one stage. Set a target and a date. Re-run all five numbers. Then choose again. The constraint moves once you relieve it.
What fixing the wrong stage looks like
It looks like more of everything except revenue. More ad spend, more leads, more estimates, more quotes, a busier team, and a year-end number that did not move. The owner concludes the market is soft or the agency is bad. Usually neither is true. The stage that was limiting revenue was never touched.
It also looks like fatigue. Teams can feel when effort is going into the wrong place. A sales team that is handed more leads while the follow-up process is broken will not become more motivated. It will triage, and the leads that get dropped will be the ones that cost the most to acquire.
Keep the numbers on one page
Once you have the five numbers, keep them on a single page and refresh them monthly. Add a line for the intervention you chose and the date it started. A constraint that has been fixed shows up as one number moving while the others hold. A constraint that was misdiagnosed shows up as nothing moving.
This is the whole discipline. It is not sophisticated. It is simply refusing to spend on a stage until the evidence says that stage is the limit.
Questions leaders ask
What counts as a qualified lead?
A lead that fits what you sell, where you serve, at a job size or contract value worth pursuing, with a way to contact them. Write the definition down and apply it consistently. If half your inquiries are outside your area or below your minimum, you have a targeting problem, not a demand problem.
What if we do not have clean data for these five numbers?
Then the first fix is logging. Make every lead create a CRM record, every first contact log an activity, and every closed deal record a value. Two months of clean data beats two years of guesses. You can usually reconstruct close rate and repeat rate from invoices in the meantime.
Can two stages be the constraint at the same time?
Two can be weak, but only one is limiting revenue at any moment. Fix the one earliest in the sequence that is below benchmark, since problems upstream distort the reading downstream. Slow response looks like weak conversion. Weak conversion looks like weak demand. Order matters.