
Across 26 business websites in Canada and the United States, the median site engaged 52 percent of sessions, held a visitor for about two minutes and turned 3.1 percent of sessions into a measured conversion. A quarter of the sites recorded no conversion event at all. Organic search sessions converted at more than twice the rate of direct sessions. The most common constraint is not traffic. It is measurement, then follow-up.
What this benchmark is
The Growth Constraint Benchmark is Megawebvision's quarterly read of how mid-market business websites actually perform at each stage of the lifecycle, built from the Google Analytics 4 properties of the businesses we work with. This first edition covers the three complete months from June 1 to August 31, 2026.
It exists because most benchmarks quote averages from very large consumer sites. A regional windows manufacturer, a commercial cleaning company or a professional services firm has nothing to compare against. These numbers are that comparison.
Method
Thirty GA4 properties connected to the operator account were read once each through the GA4 Data API, in read-only mode. Megawebvision's own properties were excluded. Properties with fewer than 100 sessions in the period were dropped, leaving 26. Each property was assigned to one industry bucket. Buckets with fewer than four properties are suppressed, so healthcare and education are folded into the overall figures only.
Every figure below is a median across properties, not a pooled total, so one large site cannot move the number. Per-property rows never leave a private store; only the aggregate table is published. Engagement rate, average session duration, pages per session, mobile share and channel share are standard GA4 metrics. Conversion rate is key events per session, which depends on each business having set up key events. That dependency is itself a finding.
- Properties scanned: 30. Eligible: 26. Errors: 0.
- Home services: 8 properties. Professional services: 10. Retail and ecommerce: 5.
- Period: June 1 to August 31, 2026. All values are property medians unless stated.
Headline numbers, all 26 sites
The median business website in the sample looks like this.
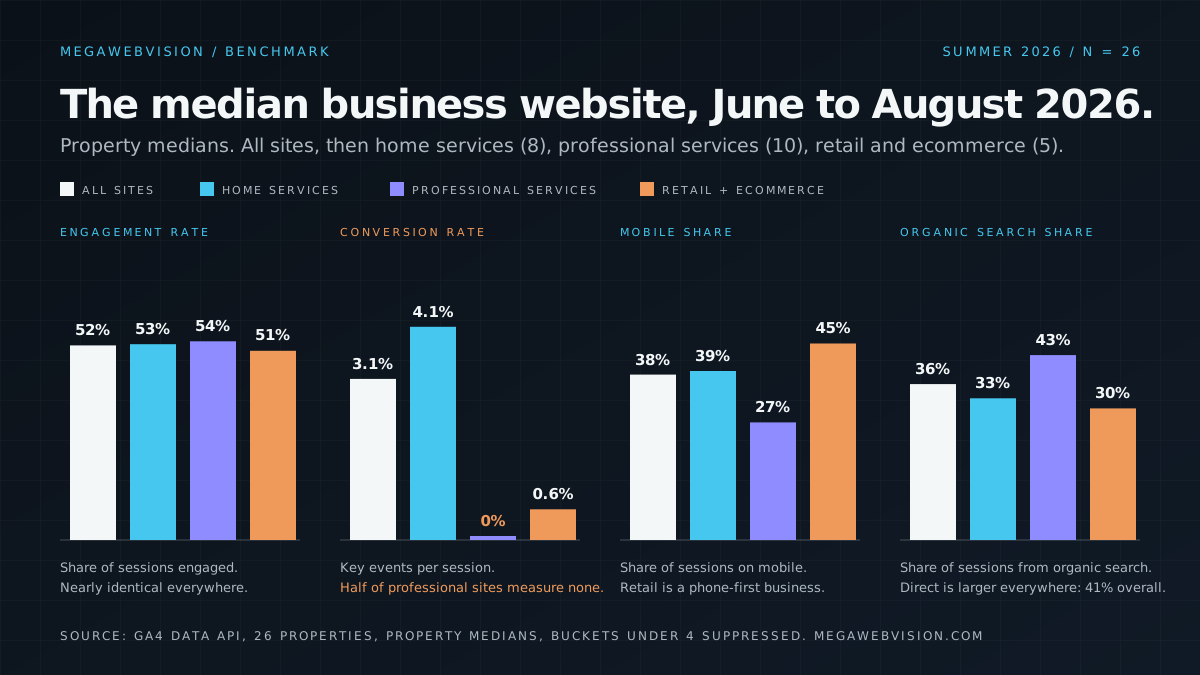
- Engagement rate: 52 percent of sessions (middle half of sites: 43 to 63 percent).
- Average session duration: 137 seconds (middle half: 107 to 192 seconds).
- Pages per session: 1.7.
- Conversion rate, key events per session: 3.1 percent (middle half: 0 to 5.9 percent).
- Mobile share of sessions: 38 percent (middle half: 24 to 53 percent).
- Channel mix: direct 41 percent, organic search 36 percent, paid search 1 percent, referral 2 percent, organic social 1 percent.
Finding one: a quarter of sites measure nothing
The 25th percentile for conversion rate is zero. One site in four recorded no key event in three months. Those sites have forms, phone numbers and quote buttons. They do not have a measured conversion, so nothing downstream can be judged: not the channel, not the landing page, not the follow-up.
In professional services the median itself is zero. Half of those sites cannot say which visits produced a lead. This is the cheapest constraint in the benchmark to fix and the one with the largest effect on every later decision.
Finding two: organic search converts better than direct, and better than paid
Across all sites, organic search sessions converted at a median of 5.1 percent, direct sessions at 2.2 percent. In home services, where paid search is a real channel at 17 percent of sessions, organic search sessions converted at 17.3 percent against 9.3 percent for paid search.
The usual reading is that search intent is stronger. The operational reading matters more: organic visitors arrive on a page that answers their question, paid visitors often arrive on a page built to capture them. When the organic page converts at nearly twice the paid rate, the paid landing experience is the constraint, not the budget.
Finding three: direct is the largest channel, and it is mostly untracked demand
Direct traffic is the single largest channel at a median 41 percent of sessions, and 53 percent in professional services. Some of that is returning customers typing the address. Most of it is demand that lost its source: links in emails, messages, documents and untagged campaigns.
A site with 41 percent direct traffic and 2.2 percent direct conversion is paying for demand it cannot attribute and cannot repeat. Campaign tagging and CRM source capture are the fix, and they cost days, not quarters.
By industry
Three buckets had enough properties to publish.
- Home services (8 sites): engagement 53 percent, conversion 4.1 percent, mobile 39 percent, paid search 17 percent of sessions. The strongest measurement discipline in the sample and the only bucket where paid search is material.
- Professional services (10 sites): engagement 54 percent, conversion 0 percent at the median, mobile 27 percent, direct 53 percent of sessions. High engagement, no measurement, heavy untracked demand.
- Retail and ecommerce (5 sites): engagement 51 percent, conversion 0.6 percent, mobile 45 percent, pages per session 2.8. Visitors browse more and convert less, which is the expected shape of catalogue traffic.
What to do with these numbers
Compare your own GA4 property against the medians in this order.
- If your conversion rate is zero or unknown, stop. Define key events for every form, call and quote request before reading anything else.
- If direct traffic is above 40 percent, tag every campaign link and capture the source in your CRM. You are buying demand you cannot see.
- If organic converts well above paid, rebuild paid landing pages to answer the question the way the organic page does.
- If mobile share is above the median and mobile conversion trails desktop, the constraint is the mobile form and the phone path, not the traffic.
- Re-read the same numbers next quarter. The benchmark is repeated each quarter with the same method.
Questions leaders ask
Where does the data come from?
From the Google Analytics 4 properties of businesses Megawebvision works with, read once each through the GA4 Data API with read-only access. Megawebvision's own properties are excluded. Only aggregated medians and quartiles are published; no client is identified and no per-site row leaves a private store.
Why medians and not averages?
A median is the middle site. It cannot be moved by one large property, which an average can. The middle half, from the 25th to the 75th percentile, shows how wide the spread is. Both are more useful than an average for deciding whether your own site is behind.
How is conversion rate defined?
Key events divided by sessions, as reported by GA4. It depends on each business having configured key events for forms, calls and quote requests. Sites with none configured report zero, which is why a quarter of the sample shows no conversions and why measurement is the first finding.
Can I compare my site to these numbers?
Yes, if your property is a business website with at least a few hundred sessions a quarter. Compare engagement rate, key events per session, channel mix and mobile share for the same three months. Differences above the middle-half range are worth investigating; differences inside it are noise.